The Results
Okay, now we’re getting into the heavy stuff. The results and discussion sections represent the “meat and potatoes” of a scientific paper. If you’re a student writing for an assignment, this is where the bulk of the marks are. The results section is the easiest of the two and you can write most of it by following a fairly simple formula: Introduce and explain present observe. You then simply repeat the three steps for each set of results being reported in your paper. Let’s look at this in more detail and expand on each section.
Introduce and explain
Hang on, isn’t that what the introduction is for? Correct, but you need to reiterate a little in the results. Before you dismiss this as folly, consider your paper again from the readers’ point of view. They have no previous experience with this paper. You know what you did, but they don’t, so you must explain to them what you’ve done and why. Think of it as guiding them down a winding garden path.
Or, continuing with the Star Wars analogy, consider the role of Obi-Wan in the film. Doing short, to-the-point explanations is his stock-in-trade. If you think about it, almost everything Obi-Wan says in Star Wars is actually explanatory dialogue for the benefit of the audience. Luke, the audiences’ guide, asks the questions about things that both he and the audience don’t understand; and Obi-Wan, being the wise and knowledgeable mentor character, dutifully answers them, giving us insight into what’s going on and why. In writing the results section, you’ll have to play the role of Luke and whine about not being able to go to Tosche Station ask yourself “what does the audience need to know here?”
In contrast, the worst thing you can do in your results section is to start it with a table or figure with absolutely no introductory explanation. Without explanation, a table might as well be a bunch of random numbers in boxes: it’s completely meaningless to the reader.
This doesn’t mean that you have to repeat the introduction ad nauseam. In fact, it’s quite the opposite, you just need a couple of sentences to jog the reader’s memory and let them know what’s going on, then, you hit them with the results. For example “in order to test [condition y], we set up [experiment x] using [this], [that] and [the other] and recorded the results in Table 1.” You then present Table 1. It’s that easy. This gives the reader context and the ability to follow the data in the table. Many papers also preface their introductory statements with a bold newspaper-style headline that summarises what they found first. Then they proceed with explaining what they did and follow that up with the data to back up their claims.
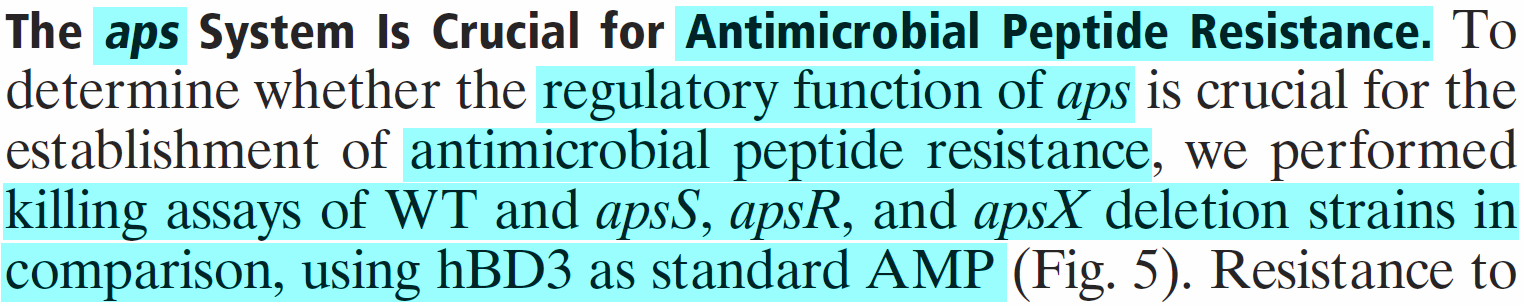
We can see this method of results reporting in action in this figure. As previously, jargon is highlighted in light blue, so if we read around it, the first sentence essentially says: "The [system under study] is crucial for [the phenomenon we're interested in]". This is in bold and is basically a newspaper sub-heading. It tells the reader what they've found and then follows it up by telling them what they did to figure it out: "To determine whether the [thing we're looking at] is crucial for [the phenomenon we're interested in], we performed [a series of experiments]." Then they tell the reader exactly where to find the results of those experiments, in Figure 5. It's short and to the point, and the reader is left with no ambiguity as to what's going on when they see Figure 5. (Li et al., 2007.)

You can see a slightly different approach in this paper. The headline is less of a statement of what they found and more of a heading on what's to come. Reading around the jargon again we get "We measured [parameter x] and [parameter y] in [these things we're interested in] and compared it with [variable a]. The impacts of [this experiment] in [the things under study] were dramatic, with significant reductions in [parameter x] and increases in [parameter y] linked to [the experimental alterations we did]. See figure 2C and 3. Conversely, the [change in parameters] was inverted when [we did it the other way around]." What's interesting about this approach is that they are combining both the "Introduce and Explain" and "Observe" steps into one simple paragraph. They not only tell you what experiments they did and where to find the results, they also make the observation that the changes they found were dramatic and reversible. Later, they go on to pick up this thread and discuss it in detail in the discussion section of the paper. (Howden et al., 2011)
A trap that you should avoid is to put too much detail in your introductory statement. If in doubt, remember that you should be telling the reader what you did, not how you did it. The “how” is for the materials and methods.
For example, in atmospheric chemistry, you might say that you used a gas analyser to perform an experiment. You know that your audience are chemists, they know about gas analysers, so you don’t need tell them how to operate the machine, just that you used one. Put the specifics of operating conditions in the materials and methods so that if any readers are curious as to exactly how you did it (perhaps so they can repeat it and verify your results), they can look there.
Doing it in this way stops the story getting bogged down in insignificant details that aren’t important to the main plot. Pausing for a detailed technical explanation of exactly how the Millennium Falcon can jump into hyperspace would have completely ruined the thrilling escape sequence in Star Wars as our heroes elude capture at Mos Eisley Space Port before fleeing to Alderaan.
"I don't know about you, Dan, but I'd sure like to have seen how it works..." 20th Century Fox/Lucasfilm
Present
After you’ve introduced what experimental results you’re about to show the reader, you then need to present them. Your results will usually be in the form of either a table or a figure. As a guide, remember that the purpose of your paper is to communicate knowledge to the reader. So choose a form of data presentation that will be as easy to follow as possible. Once you’ve made your tables and figures, they need to be put into the paper and they must have a legend that describes them. The placement of the legends is important, too: table legends go above tables, figure legends go below. The legend must describe all the elements of the figure and give the reader enough information so they don’t have to constantly refer back to the main text. Again, you’re trying to make it as easy as possible for the audience to digest.
Observe
This is a step many people neglect - they often leave it and move on to the next figure or table. However, it’s actually one of the most important parts of scientific communication. The observation step in results presentation is small, but is vitally important for the narrative of your paper. What it involves is picking some salient points from the previous table or figure that fit in with your narrative, and pointing them out in the text immediately following the presentation.
The reason for this is simple: often there is a large amount of data in a table and although the reader should have looked at it, there’s no guarantee they will have noticed a particular point, nor understood its significance. By making a quick observation you are doing two things: you mark the narrative pathway along which you are leading the reader; and you create a little flag in the reader’s mind about the point you’re making. That way, when you come to explain this part of your results in the discussion, it will jog their memory and they’ll know what you’re referring to.
Marking the narrative with specific points like this gives your paper scope. The scope of your paper is the breadth of the material it covers. Since you cannot talk about absolutely everything (or your paper would be far too broad and way too long), you have to limit your scope and focus on a specific aspect or two of your study. Limiting the scope in this way also keeps the narrative on track and tightly focussed on just a few important topics. If you tried to talk about absolutely everything, your narrative would become loose and undefined. A lack of definition means that the reader is unsure of the main thrust of the message you’re trying to convey. This is why you need to select your narrative angle at the beginning: you limit your scope to something that you can cover in an interesting and digestible way.
What you should avoid doing in the observation step is to simply reiterate all the data in the table or figure in the form of sentences directly following it. This is a mistake I’ve seen many times in student papers and it usually means the student has lost sight of the reason the results are being presented in a table or figure in the first place. A table or figure is the simplest and easiest way of organising the data so that it can be read and understood by the reader. You don’t follow this up by presenting exactly the same stuff again, but this time in a more difficult to understand form. This also does nothing for the scope of the paper, because you’re attempting to draw the reader’s attention to everything in the table, which is simply not possible for data sets with more than around seven items. Humans cannot hold more than a few things in short term memory at any given time, so only point out the stuff that’s important to the main plot and make it count!
Okay, using narrative to define scope isn’t the most intuitive thing to grasp, so let’s have another Star Wars example! The broad backdrop of the Star Wars universe is epic. The story takes place in the midst of power struggles between ruling classes across an entire galaxy. That’s simply way too much for our puny human minds to comprehend all at once, so the scope of the film is deliberately limited to just a few key players interacting in only three main locations. Each side also has a simple objective: stop the other guys. It’s easy to follow because we can keep all the plot points and story threads in short-term memory which keeps us immersed in the world of the film. If there was too much going on, like too many characters and worlds to remember, and too many agendas to consider, we’d get confused and it would ruin our suspension of disbelief.